Monday, June 2, 2014

BQ#7: Unit V: Deriving the Difference Quotient

http://www.themathpage.com/acalc/calc_IMG/042.gif
http://cis.stvincent.edu/carlsond/ma109/DifferenceQuotient_images/IMG0470.JPG
BQ#7


Where does the formula of difference quotient come from? 

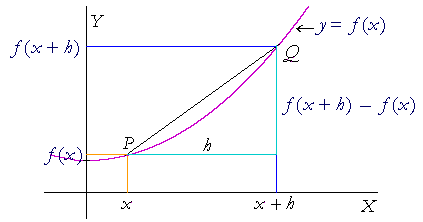
We are shown in these graphs a visual to where the difference quotient came from. We know that from one part to the other it is x. Which means that is we increase the length it would be known as x+h. We must remember that x and h are just variables they can be changed but these are just some that we prefer using since thy appear on the difference quotient. These variables can be used interchangeably doesn't always have to be x and h.  The y-values would be f(x) meaning that the point is (x,f(x)) and f(x+h) which means are point is (x+h, f(x+h)). We want to find the slope of these two points in order to be able to find the distance between them. In order to find the slope we use the slope formula being Ysub2- ysub1 all divided by Xsub2 minus Xsub1. Once we plug in all these numbers in we get f(x+h)-f(x) / x+h-x. If we simplify this the x on the denominator will cancel out giving us the difference quotient equation known as f(x+h)-f(x)/h. This can be used in order "to find the slope of a function at a single point". (google)

resources: Mrs. Kirch


https://www.youtube.com/watch?v=XA0fZh8cXV8
 
This video helps demonstrate exactly what i was referring to above but provides a greater visual as to where the difference quotient comes from. Demonstrates that the difference quotient can be derived using any function. Also, showing that it all starts from the slope formula and how it is used to find the "slope of a function as a single point." 


Sunday, May 18, 2014

BQ#6: Unit U Concept 1-4: Essential Limit Questions

1. What is continuity? What is discontinuity? 

http://upload.wikimedia.org/wikipedia/commons/e/e6/Discontinuity_jump.eps.png

JUMP 

Google.com
http://www.milefoot.com/math/calculus/limits/images/hole1.gif

Point


http://www.milefoot.com/math/calculus/limits/images/oscdisc.gif

Oscillating


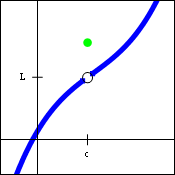
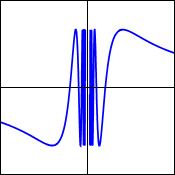
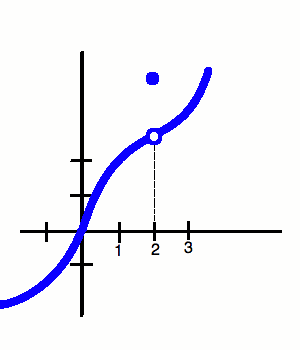
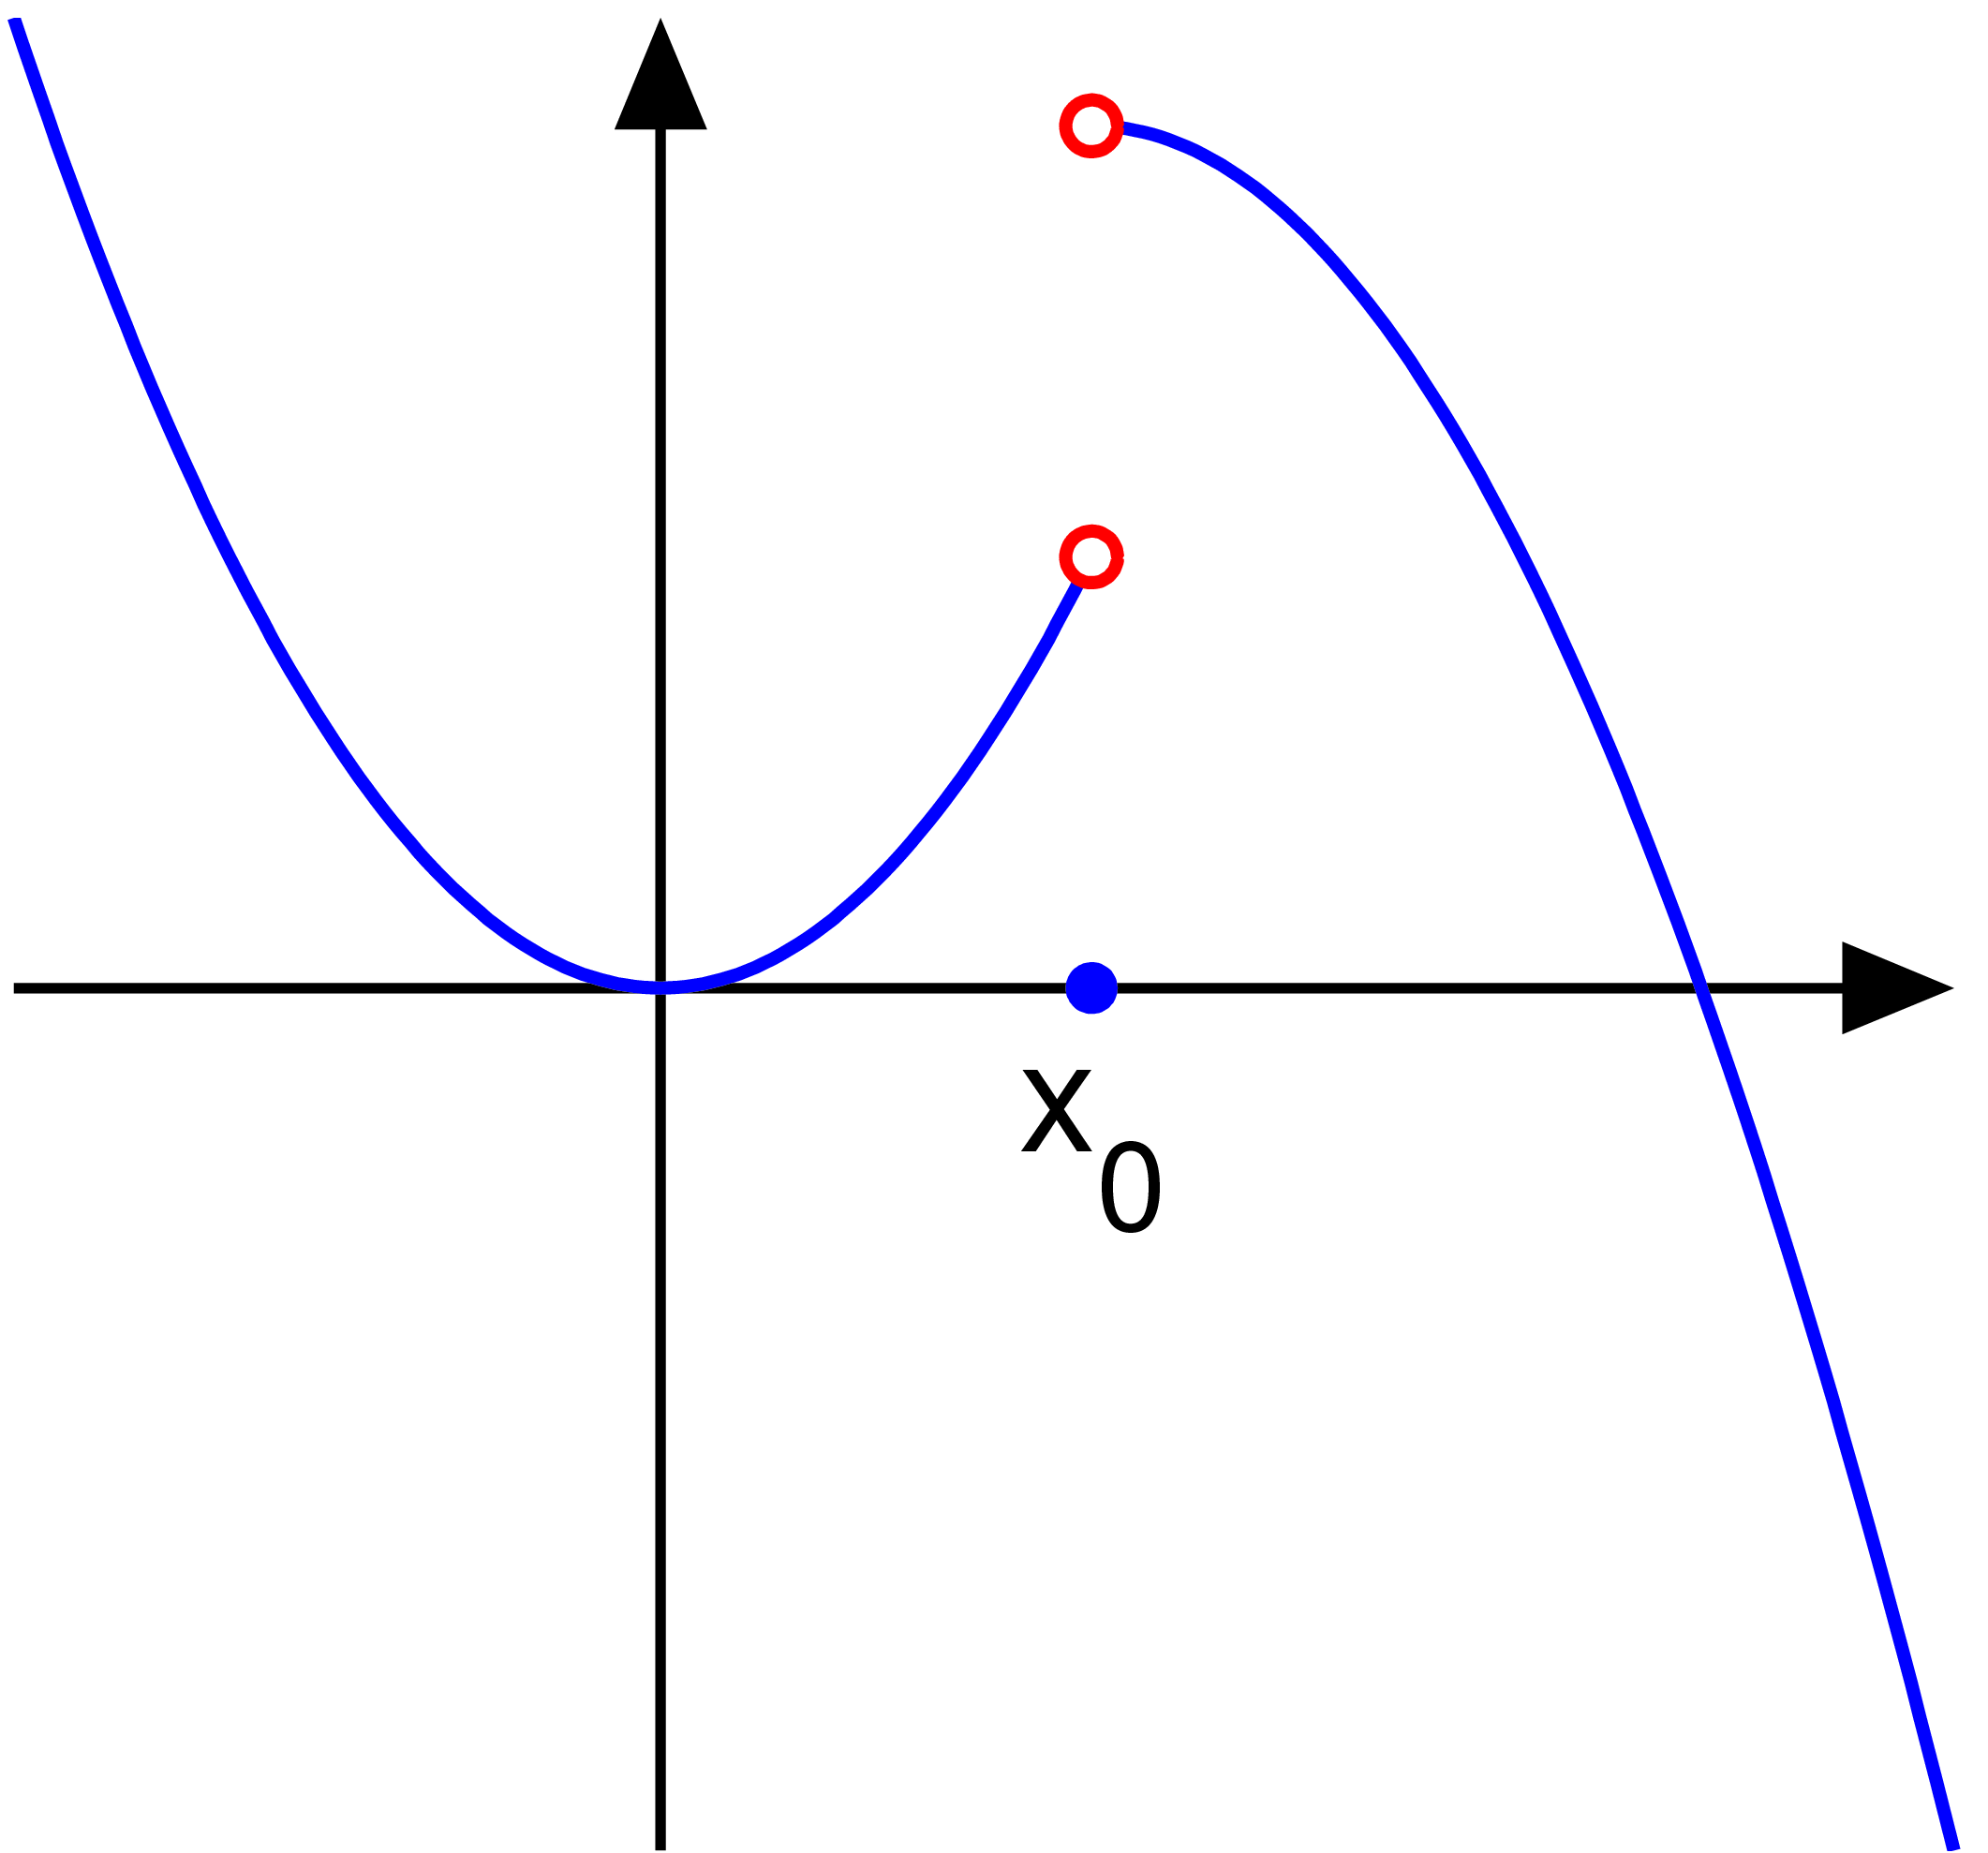
A continuous graph is predictable, has no breaks, no jumps and no holes. You can draw it without lifting up your pencil. There are two groups of discontinuities which are removable and non-removable. In the non removable group there is a point discontinuity known as a hole. In the non-removable group there is Jump which has different left/right limits, Oscillating which is wiggly, and infinite which has a vertical asymptote that leads to unbounded behavior. A discontinuous function is the opposite of a continuous because it cannot be drawn without lifting up your pencil, it is not predictable, it can have breaks, jumps and holes. The reason why a discontinuous function is separated into two groups is because in a removable discontinuity there is always a  limit but in the non-removable there is no limit. 


http://web.cs.du.edu/~rjudd/calculus/calc1/notes/dis4.png

Infinite


2.What is a limit? When does a limit exist? When does the limit not exist? What is the difference between a limit and a value? 

Limit does exist same L/R approach

Google.com 
A limit is the functions intended height at a given point. This does not mean that the point that it was intended to reach was actually reached. A limit exist when ever both the left and right meet at the same intended height. However, that does not mean that it equals the same value as the limit. A limit does not exist whenever there is a different left/ right approach. This means that there has been either a jump discontinuity, its oscillating or it is an infinite discontinuity since these do not have a limit. The difference between a limit and a value is that a limit is the intended height, the point does not actually have to be part of the graph in order to be a limit. For a value it has to be the dark circle the point that is actually part of the function, it does not matter if it is not a limit the exactitude is what matters, the actual point. 

limit does not exist diff L/R

Google.com


3. How do we evaluate limits numerically, graphically and algebraically? 

Numerically
Google.com

Graph
Google.com


Algebraically (substitution) 
Google.com

We evaluate limits numerically by using a chart. This chart helps us display what is closer to the number that we want to get to. On the far left we subtract 1 tenth and just make it closer and closer to the number in the middle, on the far right we add 1 tenth and get it closer and closer to the number we want. This helps demonstrate how the closer we get to the left or right of the function we get very very very close to the number in the center. in order to find the y values then we plug in the x-values into the function. Once we get all the y-values then we end up numbers that will lead to a middle number that will make it closer and closer to that middle number. We evaluate the function graphically by placing one finger on the left and the other on the right. We gear our fingers closer and closer to the number of the x-axis that is being asked to find the limit for if they meet then there is a limit if they don't meet there is no limit since there would be a different L/R. We evaluate the limit of a function algebraically by first checking is substitution works. Substitution should be our first options if we get a numerical answer- we are done, 0/#-we are done, #/0 undefined- we are done, 0/0- indeterminate use another method. The next method would be rationalizing/ conjugate method just depends on how the problem looks like, if something could be taken out by factoring then the factoring method would be the next option. These last two methods can be used in which ever order but substitution is always first, since it is the easiest method and will give us the answer faster. Once we have factored out something then we substitute the number in to the remaining equation and that will be our answer. When we do the conjugate we can get the conjugate from either the top or bottom just depending on where the square root is. Once we have simplified then we do direct substitution again. SUBSTITUTION should always be the FIRST option. 

Sunday, April 20, 2014

BQ#4: Unit T Concept 3: Tangent and Cotangent Differences

Why is a "normal" tangent graph uphill, but a "normal" cotangent graph downhill? 

 Tangent Graph                                                                                                     Cotangent Graph

We see on the graphs that there are 4 colors that show different sections. The red represents the first quadrant, green represents the second quadrant, orange represents the third quadrant, and blue represents the fourth quadrant. When we are graphing tangent we look at the pattern that is being placed. which would be positive, negative, positive, negative since that is what they are on the unit circle. Asymptotes are formed whenever we have an undefined answer and on the graph an undefined answer would be on pi/2, 3pi/2. The order in which we graph would be positive, asymptote cutting the graph, negative, positive, another asymptote splitting the graph, and negative. Creating an uphill graph is we only look at one period. 

For cotangent in there are undefined answer would be in 0, pi, 2pi. The graph would be positive to negative attached then it would break because of the asymptote creating an downhill graph. If we compare the two graphs of a tangent and we see that the asymptotes are placed on a different spot changing the pattern of the graph from uphill to downhill. Depending on where the asyptotes are located of the graph it will change the way that it looks because asymptotes serve as a wall barrier that does not allow the graph to go through it.
 

Friday, April 18, 2014

BQ#3: Unit T Concepts 1-3- Relation Between Sine and Cosine on Other Trig Graphs

How do the graphs of Sine and Cosine relate to each of the others? 

If we think about how all the Trig functions relate to sine and cosine we will see a connection. The rest of the functions have some sort of relation that has sine or cosine in it. 


a)
Tangent with cosine and sine 
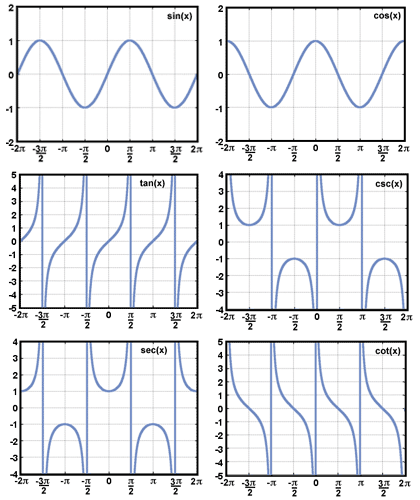
We know that tangent is equal to the trig function of sin over cosine. We have to see what will make this function undefined. The only way for it to be undefined is by having cosine equal 0. If the function is undefined we see that an asymptote is being created, not letting the graph touch or go through that asymptote it serves as a wall. We see on the graph that whenever the cosine graph is on the x axis with the value of zero there is a break on the tangent graph demonstrating the placement of the asymptote. 

b)
cotangent with sine and cosine 
The trig function for cotangent is cosine over sine. If we want to check for asymptotes we have to see where on the graph this would be true in which sine will equal 0. Sine is equal to 0 in 0, pi and 2pi. Whenever sine equals 0 on the graph we see that there is a break that cotangent cannot touch representing the asymptote. We can also see the relation between tan and cot they are faced the opposite way one is uphill the other downhill and that is because of the other and place that the asymptotes are at because 

C)
Secant with Cosine

The trig function of secant is r/cosine. "r" stands for 1 since we are using the values of the unit circle. So this means that the trig function is 1/cosine. In order to have asymptotes there must be a place on the graph that will make this function undefined. The only way for it to be undefined is by having cosine equal 0. On the unit circle unit circle cosine =0 on pi/2 and 3pi/2. This means that there will be an asymptote there. If we look at the graph we see that where ever cosine is on the x axis with a value of 0 then the graph for secant splits. This split represent the asymptote that cannot be touched.

d)
Cosecant and sine

The trig function for cosecant is r/sine. When we are talking about the unit circle the radius is one making the function just 1/sine. To find the asymptotes we have to see in which part of the graph will it be undefined making sine=0. In the Unit circle sine is 0 at 0, pi,  and 2pi. 0 is the start of the period that we are looking at and 2pi is the end which means that there is one asymptote in between being pi. If we see the graph of sine we see that the graph lands on the value of 0 on the x axis on the same points creating the asymptotes that separate the graph for cosecant making this impossible for the graph of cosecant to touch because of it. We draw the u shapes on the hump of the sine graph put it facing up if it is above the x axis and face down if it is below. 

The direction in which the hump is going( above or below the x-axis) depends on ASTC. On what the value will end up being on each quadrant.

In Cooperation with desmos.com created by Mrs. Kirch


Thursday, April 17, 2014

BQ#5: Unit T Concepts 1-3: Reason why Sine and Cosine Do not have Asymptotes

http://www.biology.arizona.edu/biomath/tutorials/trigonometric/graphics/trigbasiceqna.gif

Why do sine and cosine not have asymptotes? 
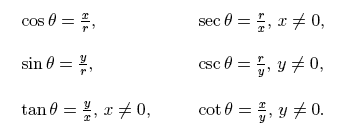
Asymptotes are formed when the answer is undefined. If we see the trig functions and what they are for sine and cosine we see that the ratio for sine is y/r and x/r. In order for these graphs to have asymptotes the ratio must me undefined. This means that they must be divided by 0 but r=1 so this will not happen because in the unit circle r is always 1. 

Why do the other trig functions have asymptotes?
The other trig functions do have asymptotes because they can be undefined in certain parts because of its ratio. We see that cosecant is r/y. If y is equal to 0 then the graph will have asymptotes when ever the ration is undefined creating an asymptote. Secant has a ration of r/x is whenever x=0 there will be an asymptote since it will be undefined. In Tangent we have a ratio of y/x if x=0 then the answer will be undefined creating an asymptote. Cotangent x/y if y=0 then it will be an undefined ratio creating an asymptote. The trig functions that have the same asymptotes are secant and tangent because they have the same denominator of x and cotangent and cosecant will have the same asymptotes because they have a denominator of y.  

with cooperation with Google.com


Wednesday, April 16, 2014

BQ #3: Unit T concepts 1-3: Relating the Trig graphs to the Unit Circle

How do trig Graphs relate to the Unit Circle? 


http://etc.usf.edu/clipart/43200/43217/unit-circle9_43217_md.gif
http://img.sparknotes.com/figures/A/ad79275cb59e569b790cb945a4ffc553/triggraphs.gif

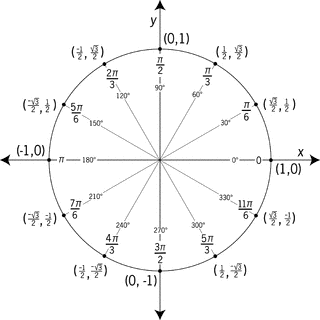
The Trig Graphs relate to the unit circle because they are originated from it in which they have been unraveled from being a circle. These trig graphs follow the same patterns as the unit circle except that they are not in a circle form more like waves. The coordinates are still the same and have the same positive and negative signs there on the trig graph. (a) A period is how long it takes in order for the cycle to repeat its pattern. The period or sine and cosine is 2pi because that is how long it takes the graph to repeat its pattern. The pattern for sine is positive, positive, negative, negative, which comes from the unit circle using ASTC. The same thing is being applies there. The Pattern for cosine is positive, negative, negative, positive, also comes from the ASTC on the Unit Circle. The reason why tangent and cotangent have a period of pi is because that is how long it takes for the cycle to be repeated the pattern being positive, negative, positive negative throughout the unit circle. The positive negative is the pattern and it is being repeated twice in one revolution of the unit circle half of 2pi is pi which is why tan and cot have a period of pi. (b) Amplitude also has a relates with the trig graphs and the Unit Circle. The Amplitude is half the distance between the highest and lowest points of the graph. In the Unit Circle sine and cosine cannot be greater than or equal to 1 or -1. With this being said those are the restrictions that are set upon those two functions. The other trig functions don't have amplitudes because because they do not have any restrictions on the Unitt Circle since tan and cot can be greater than 1 or less than -1. 

In the trig graphs they are divided in 4 sections which are the quadrants when they are put into Unit circle Form. This guides whether the graph will be going above or below the x axis. If it is above the axis than the function was positive in that quadrant, if the hump is \ the axis then the function was negative on that quadrant. 


In Cooperation with google.com

Friday, April 4, 2014

Reflection #1 Unit Q: Verifying Trig Identities

1. What does it actually mean to verify a trig identity?
When we verify a trig identity this means that we are proving that this trig identity always true. This identity should always be true no matter what is plugged into it if it is used with its rightful pair. sec and tan go together which means that they can turn into each other back and forth with the edition of the one.Since sec^2x - tan^2x= 1. This can be arranged in all sorts of ways and it will be true since it is and identity meaning that is has been proven that this equation will always work. Cos and Sin go together making cos^2x + sin^2 = 1 and it too can be arranged into different forms and it will always be true because these identities have been verified that it works. Cot and csc go together making 1+ cot^2x= csc^2x. All these identities have been verified that they are true and that will always work if they are being used in the correct form.

2. Tips and tricks i have found helpful.
Some tips and tricks that we can use in order to simplify or solve trig equations are that we can always check for a GCF( greatest common factor), conjugate, breaking down fractions that are monomials, factoring, foiling, and substitution of identities. (Kirch SSS packet). If you are completely stuck you can always change everything in terms of sin and cos. Most of the time if there is a potential way to make and identity or to form one that is the path i decide to take. The reason being that this usually tends to cancel with something else or it can become the one trig function that is left to use. When we see that we have a binomial either in the numerator or the denominator and there is no given identity then we can always multiply by a conjugate. This will help us get squares and lead us to finding an identity. When we choose to factor is is because we have either the same base or because we have multiples of 2 on our exponent. When we foil is because we  know that there is a possibilities that we may get squares making that a potential identity that can simplify to something else. The reason why we decide to change everything to sin and cos if we are completely stuck is to see if there is a different rout that we end up checking and work away around it.

3. Verifying a trig function 
To verify a trig function it means that we are not allowed to touch the second part of the equal sign. What we are trying to do is make sure that this is valid and will somehow transform into that on the other side. There are multiple ways of being able to verify this but they all have to tie back to the one that is on the other side. The side that we shall always work is usually the more complicated side. When we verify a trig function we state that this is right and that somehow it will turn to what was given to us, giving us a true statement. The first thing that we can try to look at is see what we can do to change the complicated side into the trig function(s) that are listed on the other side of the equal sign. We do this by seeing if there is a GCF that will factor out, if there is and identity. If these are not there then we go to our other options being foiling which i would only use if there are to trig functions that could become and identity if they were being squared. The next option would be finding the least common multiple which would be used if we have fractions that we would like to combine together. Our next option would be using the conjugate this would be used if we have a binomial either on the numerator of on the denominator and we would foil this out. Our last option would be change everything to sin and cos. This is mostly used if you cannot find any other way to verify the trig function in other to make it the same as what is on the other side of the parenthesis. There are times where you feel like that is all you can do in terms of simplifying the answer and it is just not the answer that is on the other side. See if you can break it down if it is a fraction, or see if there is any other way that it can be addressed using  ratio identities or reciprocal identities.  If you don't get it on your first attempt keep trying because there are multiply ways of verifying a trig function, you will eventually get there. :)